
Improving Support for Deep Learning in Etsy's ML Platform

Introduction
As new machine learning (ML) techniques continue to advance and provide the promise of better performance, platform teams everywhere are trying to adapt to support increasingly complex models. While many models served at Etsy still use "classic" model architectures (such as gradient-boosted trees), there has been a large shift and preference for deep learning techniques. The decision for the Search Ranking (SR) team to use deep learning in particular necessitated advances in ML Platform capabilities. In this post, we’ll go over the workload-tuning and observability capabilities we created to combat the challenges serving deep learning ranking at scale within Etsy.
Serving Search Ranking Use Cases
Ranking use cases tend to be trickier to serve at low latency and low cost relative to other ML use cases. In practice, this is due to the number of features, bursty nature of the requests, and strict latency cutoffs. For just one search request, we first fetch around 1000 candidate listings to be returned to the user. We then go to our feature store and get around 300 features for each of them, send that data to our machine learning services to score each of those, and then rank them and return them back to the user – all before 250ms has elapsed (with the majority before 75ms). At scale, this can lead to bursty cpu-bound workloads that are very costly.

These serving challenges were not new to the squad. In fact, existing tree-based ranking models often had high timeout rates despite being overprovisioned. However, as the modelers pushed the boundaries with new model complexity and computationally expensive feature transforms, we needed to take a deeper look at addressing and mitigating these issues.
Tooling for Early Latency Feedback
Previously, to test a model’s production latency at Etsy we needed to onboard the model onto all feature services and orchestration systems, which had a high development overhead. This meant that models were often only tested right before launch, which led to unexpected surprises and headaches. This situation is exactly what occurred in the first iteration of Search Ranking’s new deep learning model and happened too late in the model development cycle. With the challenges of this launch attempt came the opportunity to create better tooling to diagnose these issues earlier in the model development lifecycle.
Thus we created Caliper, a tool to automatically test model latency early in the model development lifecycle. With Caliper, as soon as a model artifact is trained, it can be load tested with training data and profiled with TensorBoard automatically. Users input their data, select their desired RPS and batch size, and specify what model should be used. After five minutes, they can see latency distributions in a web UI, any errors their model had, and a profile of the slow tensorflow operations in their model.

This tool streamlines a previous process where users would manually search and optimize slow transformations using ad hoc scripts and infrastructure setup. Most model performance issues are caused by slow tensorflow transforms, which this tool has highlighted early in the process.
Caliper isolated the performance testing of just the inference component itself, allowing users to more quickly test inference-specific tuning parameters rather than spinning up the whole system. One key parameter we uncovered was batch size of the requests. In previous ranking models, we kept the batch size small for parallelizability. However, increasing the batch from five to 25 did not increase the latency substantially on the server side (which is measurable with Caliper), but greatly decreased the overhead of requests being prepared by the orchestration layer.
Investing in Observability
Triaging latency at a systems level
After closing the gaps of transformation-caused latency and tuning the batch size, we were able to launch. However, we were not yet out of the woods, and were still seeing client side timeouts on requests to our ML services. Since each "request" to our system was actually a batch of 25 candidate to score, a single failed request meant multiple prediction failures. Even though requests were timing out at 250ms, the model was actually making predictions quickly (~50ms) - which means somewhere in our system there was an extra 200ms of overhead! Relying solely on prometheus histogram metrics for our client, proxy, and TF Serving container did not help us narrow in on the overhead as the buckets were too broad and data too aggregated to be helpful.
Luckily, Etsy had been increasing adoption of distributed tracing and the service proxy Envoy which led to a much-needed increase in observability. With distributed tracing, we were able to see more granular samples of latency across components on an individual request level rather than just knowing our p99 (99th percentile) was somewhere in the 100ms to 250ms range. In addition, Envoy access logs allowed us to get a breakdown of where in the process that latency was occurring. As it turns out, as much as 200ms was spent in transmitting the features from the client to the proxy, before it even got to the model.
Cutting down on payload size
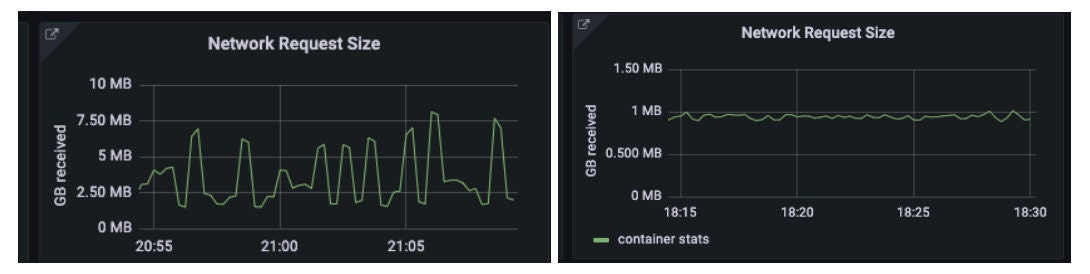
With our new observability tooling, we learned up to 80% of the overall request time was spent sending features to our proxy. While the “features transmission” time was not linear with the payload size on a request-level, the fact that this search ranking model struggled from this issue when our ads ranking model did not make the problem seem workload-related. We knew this model was slightly slower and had ~20x as large payload with many more features.
The protobuf payload for the search ranking’s deep learning model was just under 1MB, already down from an average of about 4MB from our existing json payload for the decision tree model, so we thought we were already doing better with regards to payload size and were surprised this could be a bottleneck.
Our friends on the search orchestration team pushed onwards in the investigation and eventually tried using compression with grpc yielding much smaller payloads that were roughly 25% the size. This change decreased search model’s error rates by 68% and reduced p99 (99th percentile) latency by around 50ms.

Future
Now that we are in the world of deep learning for search ranking, we can only expect the features to increase and the model to become more complex. We are continuing to work with search orchestration to further decrease payload size and transport overhead through “shared features” format (sending contextual data only one time for the whole batch rather than repeating it per listing). We are partnering with our feature systems team to explore ways to compress our feature payloads such as feature mapping as our names can get very long.
In parallel, we are also improving Caliper and our automated infrastructure tuning processes to make these tough-to-diagnose performance issues even smoother and self-service for users with complex and high scale models.
Special thanks everyone who contributed to this work, including but not limited to Rob Miles, Harshita Meena, Derrick Kondo, Hassan Shamji, Chris Long, Arijeet Mitra, Ahmad Ragab, Tim Korn, Dennis Olvany, Karl Kamden, Julie Chien, and Mert Sanver.
Thanks to all our awesome search ranking team for being patient and pushing our craft forward, including Lucia Yu, Congzhe Su, Cung Tran, Robert Forgione, Lei Hu, and Xiaoting Zhao.